Crime data for investment analysis
Modular feature in b2b SaaS Product
CRE, US
UX Research, Information architecture, Stakeholder management, Prototype, Interface design
Assessing crime reports is an essential step for screening deputies and appraisers. The existing offerings are often too simple or too complex to comprehend. With this project the goal is to offer our users an interactive report with layered data granularity on demand.
Interview and understand how users expect to use the crime data in their workflow.
Gather user insights from stakeholders’ conversations with top tier clients and align expectations and priorities.
Deep dive into data quality, expected behavior, refresh rates, and limitation with data scientists and engineers.
Product analysis on existing solutions in both CRE and private sectors.
The data should resemble what a well versed appraiser that have been analysing the area would know.
Temporal insights are very useful but are lacking in all existing products.
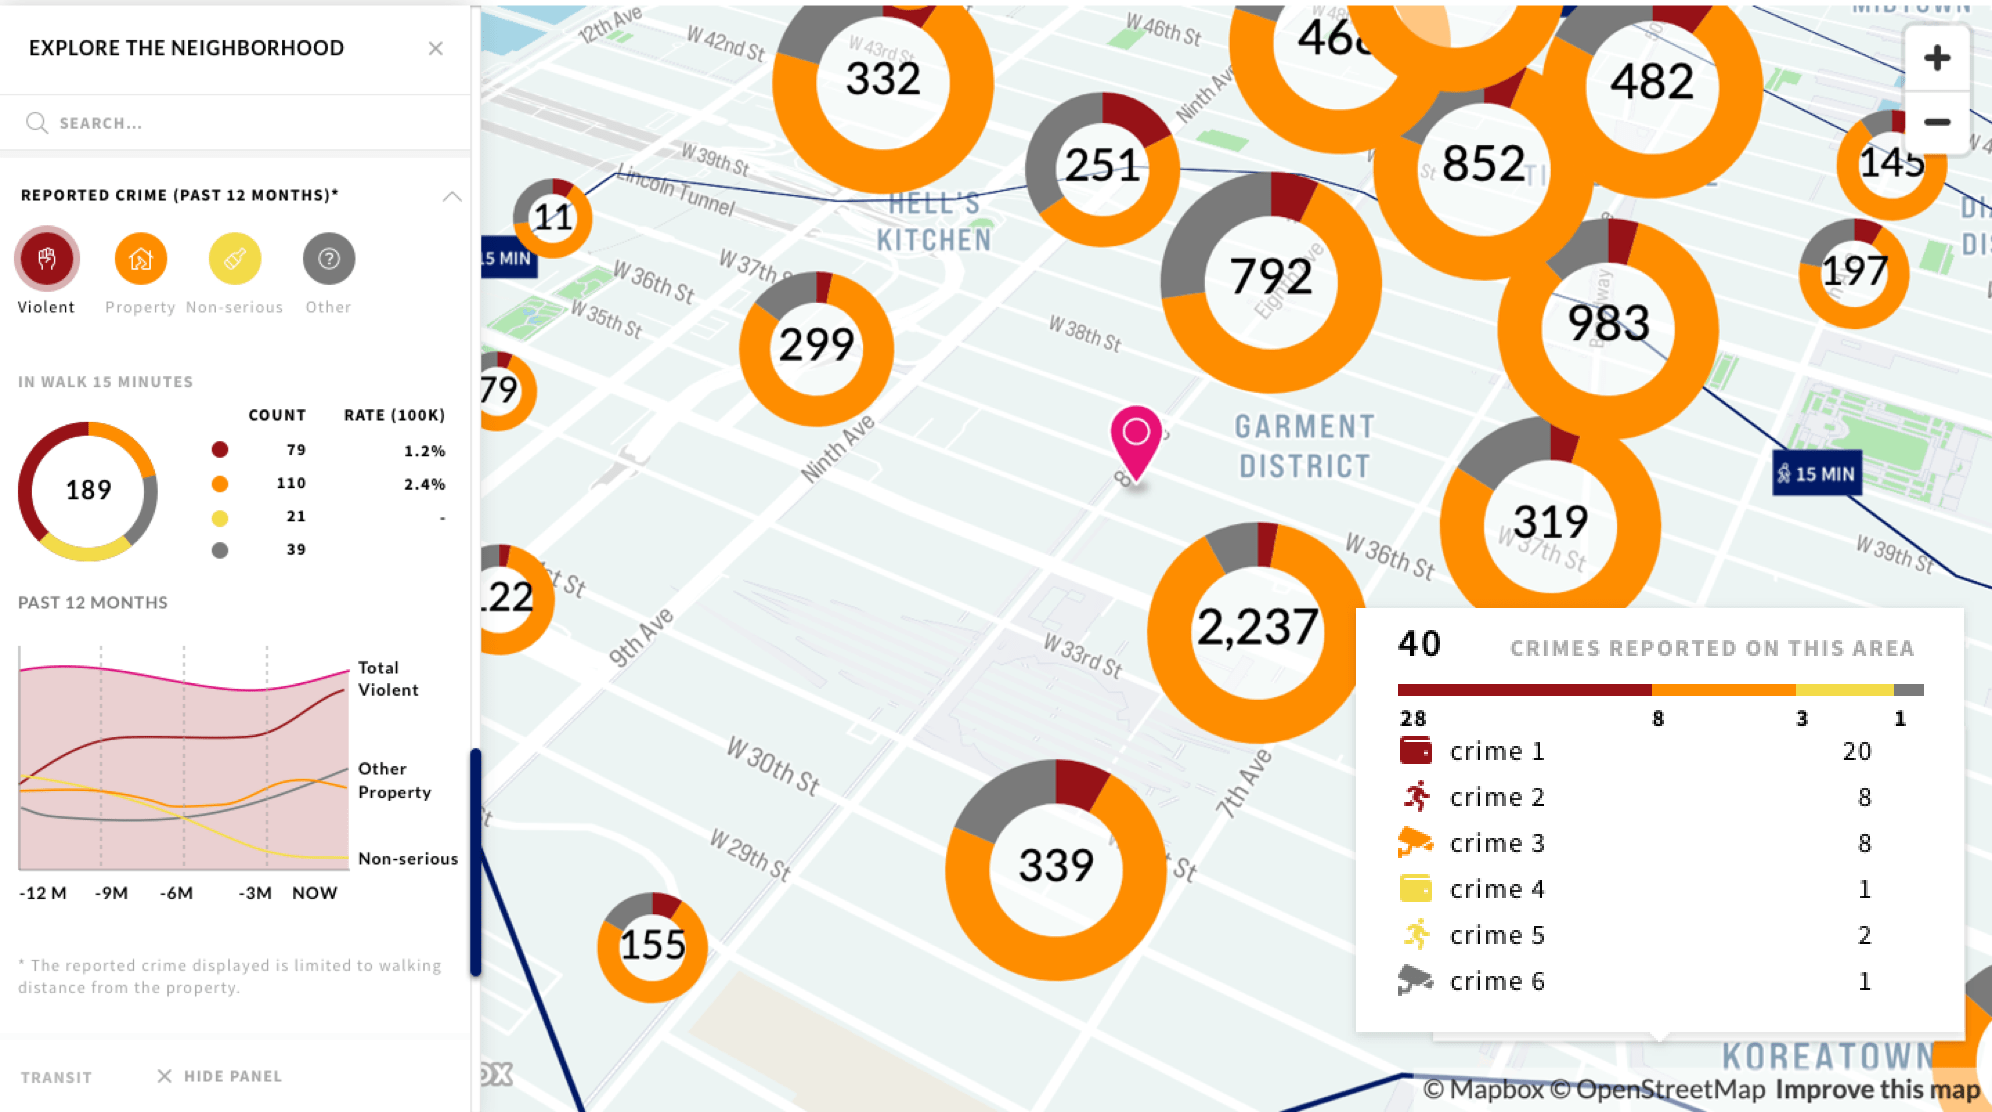
On first glance all a user wants to know is if there are many serious crimes in the scene, then more detailed information on demand.
Every state collects data differently and this needs to be addressed.
The data size is a huge limitation and a workaround is required.
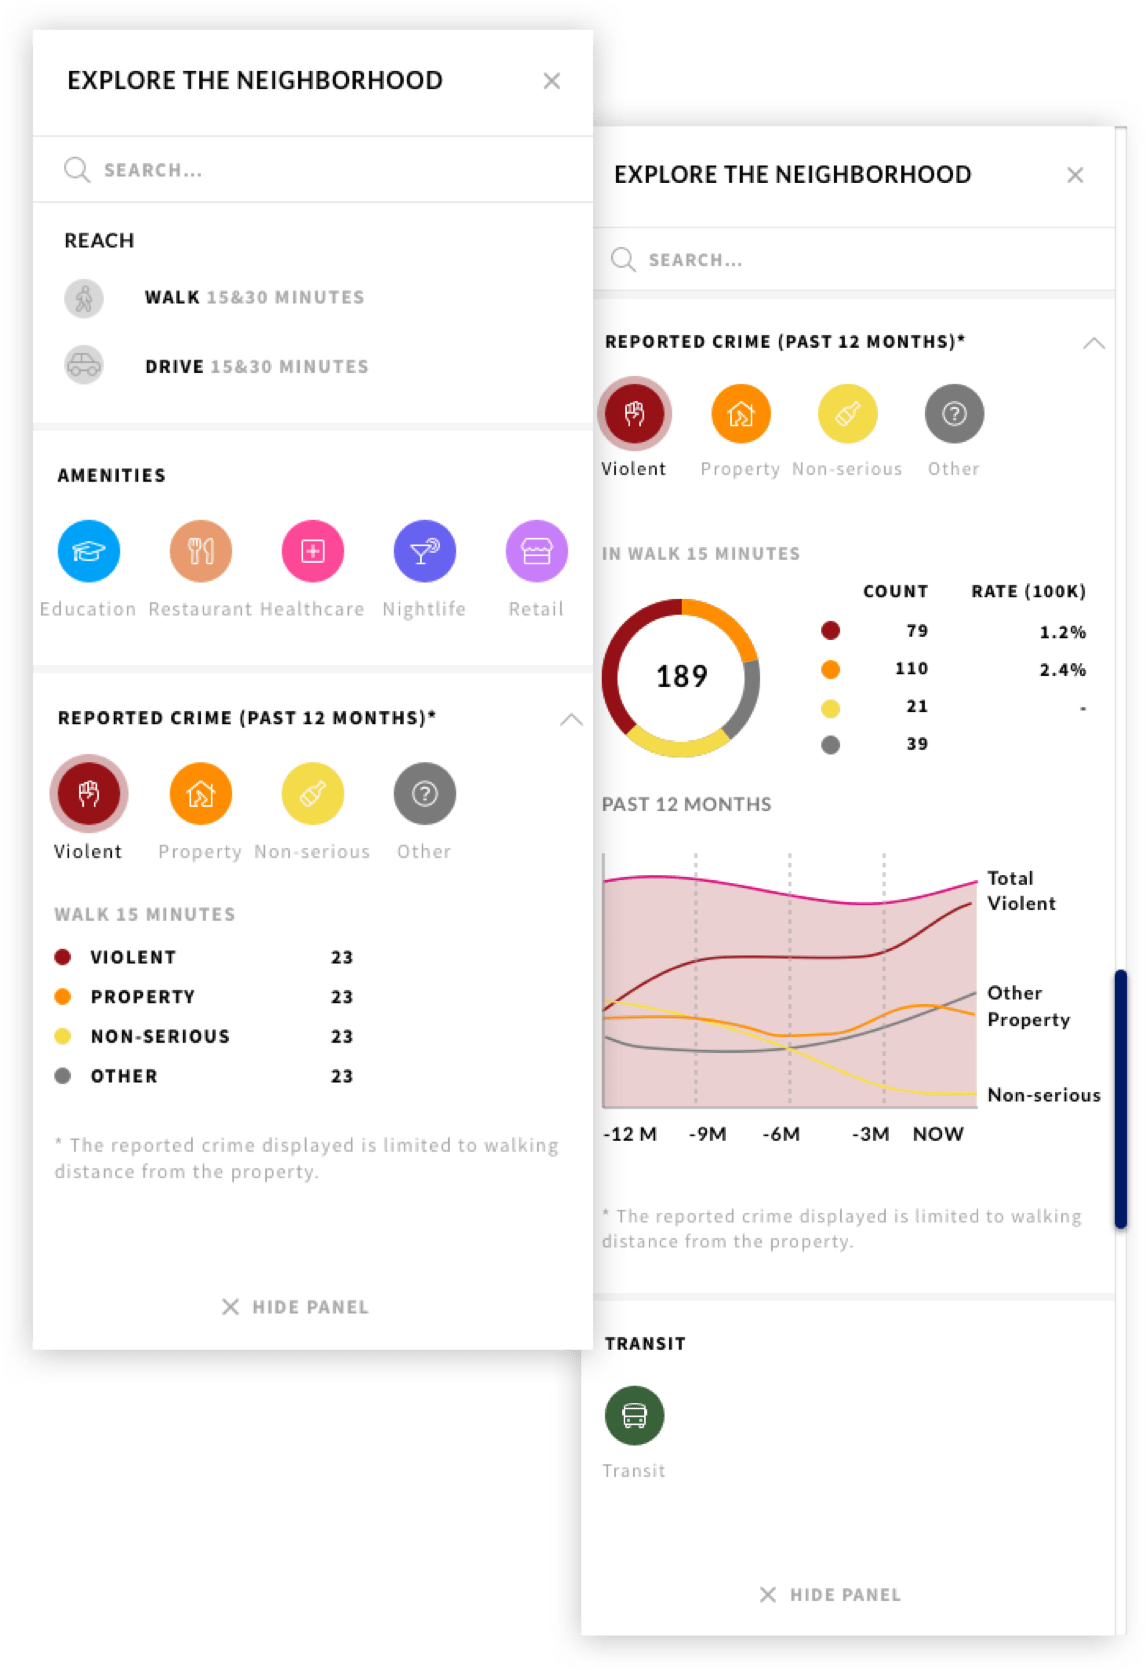
There are 2 levels of IA to consider for the feature: 1) How does it fit into the current offer and 2) How can the data itself be layered to allow novice and expert users to assess different types of information quickly.
My core concern is around how to benefit the user most with the added crime data. Including the crime data in a bigger segment allows users to overlap different data points and get a better sense of the neighborhood. A human appraiser would have an holistic view of the neighborhood.
Each crime data is both broad and in-depth: there are more than 30 types of crimes; from murder to drunk-driving and detailed to the responsible officer’s name. I created multiple categories and themes to provide the broad strokes, while arranging the data to give users autonomy in creating their own detailed data mix.
At this stage the key objective is to get the stakeholders to focus on one design direction and map out all the concerns. I showed the stakeholders individually the early sketches and refined the design with their input. Getting most details out of the way, we managed to narrow down to one direction quickly and focus on the product implementation roadmap during the presentation, where all stakeholders were present.
The concept was also tested with users to get their feedback. I prepared a working prototype and several UX possibilities. It is not easy to have access to the users given the industry, so we made sure to keep users' attention by using real data, setting clear objectives and testing it in segments.
Working together with the developers, I created a 4-step implementation plan to version the feature into sprint-size bits. The earlier we could show the users the faster we could get feedback and improve. Each version could be standalone, but added more complexity as the feature progress.
I’m really happy with this project because the communication between all parties were really good. With new datasets like this, things could turn ugly really fast and this one is no exception, but by communicating on time we minimized the damage and delivered an MVP to users in 3 sprints. I felt reallly proud of my team and myself in making this happen.